
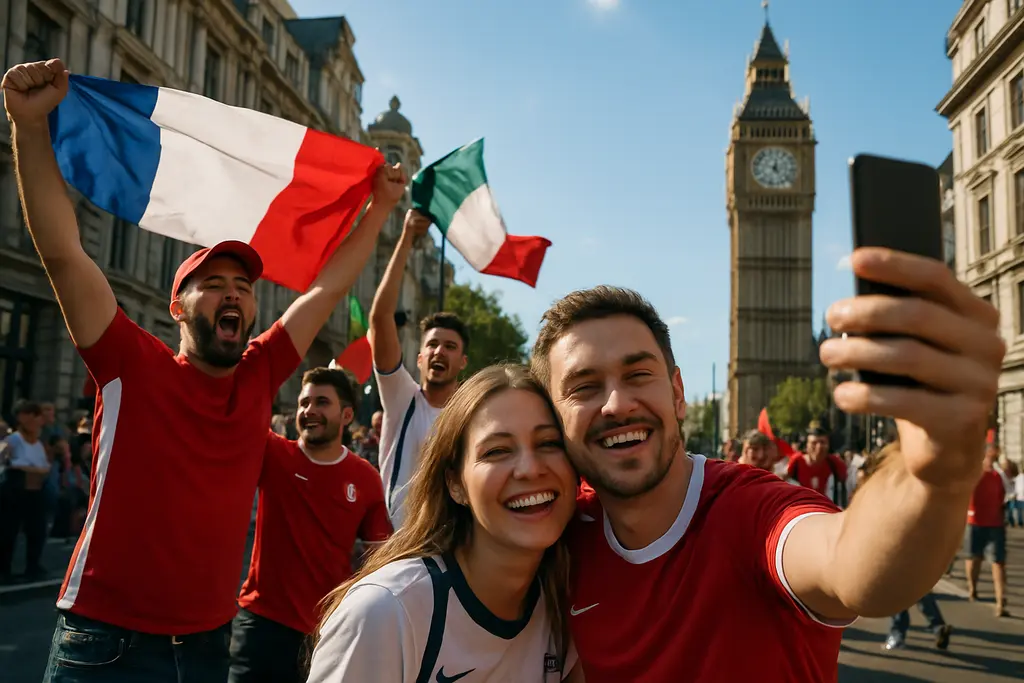
World Cup tourism left a measurable mark on host-city travel after the 2026 FIFA World Cup ended on July 19, 2026. The strongest evidence came from lodging, cross-border travel, local spending, and city mobility patterns rather than from broad claims about long-term legacy. The tournament drew approximately 6.8 million attendees across North America, nearly double the 1994 attendance record, while U.S. host-market hotel room revenue rose 36.3% year-over-year on match dates and generated an estimated US$633.8 million in incremental room revenue during match periods, according to Tourism Economics.
For a sports analyst, the useful question is not simply whether the event was big. The sharper question is where demand appeared, how cities absorbed it, and which gains were tied to match timing. Soccer events create a different rhythm from league seasons because visiting supporters move in waves around fixtures, fan festivals, and team routes. The 2026 event offered a rare data set across Canada, Mexico, and the United States, but the evidence still calls for care: match-period spikes do not automatically prove durable tourism growth after the tournament.
World Cup tourism By The Numbers
World Cup tourism Attendance Scale
The attendance figure is the cleanest starting point. A total near 6.8 million across North America gave tourism boards, hotel operators, airports, restaurants, and public agencies a large visitor base to measure. It also changed the frame for comparing 2026 with past World Cups. The 1994 tournament in the United States has long stood as a major attendance marker; 2026 nearly doubled that record, according to the research data provided.
The scale matters because it spread demand across many markets instead of concentrating it in one host nation. That distribution made the event less like a single-city mega-event and more like a continent-wide sequence of matchday surges. From a tourism standpoint, that pattern can lift many markets at once, but it can also make the after-action picture uneven. A city with high hotel capacity may show strong rate growth without severe room shortages, while a tighter market may face displaced demand and missed spending.
Match Dates Changed Hotel Math
Hotel data gave one of the clearest signals. In U.S. host markets, RevPAR grew 14.6% during June and July 2026, compared with 11.3% in adjacent markets and 6.8% in non-host areas, based on the same Tourism Economics analysis. That gap matters because it suggests the host-city effect was not simply a national summer travel pattern. Adjacent markets also benefited, which is consistent with overflow lodging, regional travel, and fans staying outside primary host locations.
The match-date revenue increase also points to pricing power. Average rates and occupancy tend to move differently depending on supply constraints, length of stay, and booking windows. During an event of this scale, fans often cluster arrivals around match days rather than spreading demand evenly across a month. That is why a 36.3% year-over-year room revenue surge on match dates is more telling than a general seasonal comparison.
Hotel Demand And Visitor Flows
Inbound Travel And Incremental Trips
The research set cited U.S. inbound travel projections tied to the tournament that estimated 1.24 million international visitors came to the United States for the event, with 742,000 considered incremental trips. If that split held, roughly 60% of those visitors represented travel that would not otherwise have occurred. That distinction is central to any credible tourism assessment. A hotel room sold to a traveler who simply shifted an existing trip is not the same economic signal as a new visit created by the event.
The timing of travel also matched the fixture schedule. The research indicated that June carried the peak impact in U.S. arrivals, with 57 of 78 U.S. matches occurring during that month. July added another smaller lift tied to the knockout stage and the closing stretch of the tournament. The clearest World Cup tourism lesson is that match density shaped visitor flow, which is a planning issue for airports, hotels, transit systems, and fan sites.
Spending Categories Beyond Rooms
Visitor spending extended beyond lodging. The research notes cite nearly 20% year-over-year growth in cross-border transactions across host cities in Canada, Mexico, and the United States during June and July 2026. The cited sectors were transportation, entertainment, retail, lodging, and restaurants. Those categories fit the behavior of traveling supporters: move between venues, gather before and after matches, buy team gear or local goods, and spend on food and drink around match windows.
Restaurant and bar spending also separated host cities from non-host cities in the research notes. U.S. host cities recorded 5.3% growth in in-person spending at restaurants and bars over the same prior-year period, compared with 3.8% in non-host U.S. cities. That difference is not large enough to support sweeping claims by itself, but it adds weight to the idea that match hosting produced localized spending gains during the tournament.
Vancouver, Toronto, And City-Level Pressure
Vancouver Forecasts And Capacity Questions
British Columbia framed Vancouver’s role before the tournament through a mix of match attendance and longer-tail tourism expectations. The province said hosting seven matches at BC Place was expected to draw approximately 350,000 spectators, plus 1 million additional out-of-province visitors during the tournament and in the five years after it; it also forecast CAD 1 billion in provincial GDP and more than CAD 200 million in tax revenues, according to BC Gov News.
Because that provincial release was a forecast, it should be treated differently from post-event hotel receipts or attendance counts. Forecasts are useful for understanding public planning assumptions, but they are not final results. The Vancouver accommodation shortfall cited in the research set also showed the risk side of hosting: during the most strained nine-day tournament period, the projected shortfall reached 70,000 nights, averaging about 7,700 people per night, with a peak estimate of 14,700 unaccommodated fans on the highest-demand day.
That capacity issue is a sports-business point as much as a tourism point. A sold-out city can post strong hotel numbers while still leaving visitor spending on the table. The research cited an estimated CAD 45 million in direct lost visitor spending from the shortfall, rising to CAD 78 million in turnover when multiplier effects were included. Those figures suggest that venue selection, lodging supply, transit, and regional hotel coordination are connected parts of the same event plan.
Toronto Movement Around The Venue
Toronto’s reported event pattern showed how tourism can change movement inside a city. The research notes said the city hosted six matches and ran a 23-day fan festival. Around 250,000 fans attended matches, while more than 350,000 people attended the festival. Visitor spending composition included international, U.S., Ontario, and rest-of-Canada segments, which suggests Toronto drew both long-haul and regional demand.
The mobility data were striking. During match periods, pedestrian traffic around Toronto Stadium reportedly ran 70% to 160% above baseline, while cycling rose 25% to 140%. At the same time, motor-vehicle volumes on the Gardiner Expressway dropped 10% to 30% below baseline. For host cities, that pattern offers a practical lesson: fan movement is not just about getting people into seats. It is about how supporters move through streets, fan zones, transit nodes, and nearby commercial districts before and after kickoff.
Sports-Business Lessons From The 2026 Event

Host Markets Did Not Benefit Equally
For analysts, World Cup tourism should be evaluated city by city rather than as a single North American story. Boston, for example, hosted seven matches between June and July 2026, and the research notes reported that Greater Boston’s hotel ADR reached US$410.44 and RevPAR reached US$357.36 across the period. Those were increases of 20.7% and 20.3%, respectively, versus the same days in 2025. On match days, the figures climbed to US$445.45 for ADR and US$405.50 for RevPAR.
Houston offered a different type of signal in the research notes, with a 17.3% increase in final-destination arrivals at serving airports in June. That kind of airport measure can help separate true destination demand from connecting traffic, though it still needs context from hotel stays, local spending, and match schedules. The safer reading is that some cities converted matches into clear travel gains, while the size and shape of those gains depended on schedule placement, team draws, market capacity, and regional access.
Infrastructure And Event Operations Mattered
The 2026 event reinforced that host-city tourism is tied to infrastructure choices made years before the opening match. Stadium location, hotel inventory, airport capacity, local transit, pedestrian planning, and fan festival sites all shaped the visitor experience and the economic capture. For readers interested in exploring off-field planning aspects of major sports facilities further, CAD/CAM coverage can provide additional insights into design and venue planning.
The strongest evidence from the tournament came from near-term indicators. Hotel revenue, RevPAR growth, airport arrivals, local card spending, and pedestrian movement all responded during match windows. Longer-term tourism gains require separate measurement after the event, especially in cities where pre-event forecasts included benefits stretching several years beyond 2026. A disciplined read avoids treating every busy restaurant or full hotel as proof of lasting economic change.
What 2026 World Cup tourism Revealed
The 2026 FIFA World Cup showed that mega-event soccer can create sharp, measurable tourism gains when matches are tied to high travel demand and limited lodging supply. The evidence was strongest in hotel performance and match-period visitor activity. It was more cautious on long-term legacy, where forecasts still need post-event verification.
The fairest assessment is that host cities gained real short-run tourism value, but the benefits were not automatic or evenly distributed. Markets with enough rooms, strong transit options, and well-placed fan activity were better positioned to capture spending. Cities facing accommodation pressure risked losing some demand despite strong interest. That is the central sports-business lesson from 2026: the match is the draw, but city planning determines how much of that draw becomes measurable local value.