

Soccer analytics is like solving ancient math puzzles. Instead of pharaohs, we have players missing easy shots. Numbers now tell us about goals, assists, and appearances. They turn simple data into a guide for scouts.
Ever wonder how a young player from Bolivia ends up in a top team like Bayern Munich? It’s not magic. It’s all about the numbers.
Bolivia’s Tahuichi Academy has sent over 85 players to the pros. They use a mix of data and old-school scouting. Modern tools track every move, while local scouts discuss players over salteñas (empanadas).
StatsBomb’s xG framework shows the real story behind a goal. It’s not just luck. It’s a calculated risk.
Knowing these stats isn’t just for experts. It lets you see more than just the game. When a player’s “appearances” show their endurance, or an “assist” is a clever pass, you’re reading the game.
The Core Stats: Goals/Assists/Appearances
Marco Etcheverry’s 1994 season is key to understanding football stats back then. Assists were barely noticed in the stands. Let’s look at simple statistics through the eyes of Bolivia’s legendary playmaker. He made assists before they were officially counted.
Etcheverry’s 1994 season is legendary – 14 goals, 20+ unofficial assists. Using StatsBomb’s xG metrics, we see his expected goals pattern. Most of his shots were from inside the box, after beating three defenders.
But here’s the twist: assists weren’t officially tracked during El Diablo’s time. It’s like Mozart composing music that nobody wrote down.
Three altitude-adjusted truths about appearances:
- Playing 30 matches at 3,600m elevation equals roughly 45 games at sea level
- Bolivian players’ lung capacity graphs look like Everest summit charts
- Etcheverry’s 1994 minutes played? Basically a medical marvel with cleats
Modern stat nerds would go crazy trying to measure Etcheverry’s impact. His heat maps were like brushstrokes. Today, players are judged by xG percentages, but Etcheverry’s legacy is in famous Bolivian football records.
So, when someone talks about Messi’s xG stats, remind them: Greatness often happens between the numbers. And when the numbers weren’t being kept.
What Do the Numbers Mean?
Football stats are like altitude sickness symptoms – ignore the context, and you’ll misdiagnose everything. StatsBomb’s pressure maps are great for tracking defensive aggression. But in La Paz’s thin air? That’s like using a pedometer to measure a kangaroo’s hop.

Let’s get snarky: when a Bolivian defender makes 10 clearances, it’s not the same as 10 clearances in Rotterdam. At 3,650 meters above sea level, players aren’t just battling opponents – they’re wrestling with 20% less oxygen. European scouts analyzing South American youth leagues often make the metric miscalculation of comparing apples to altitude-adjusted apples.
Why Context Eats Raw Numbers for Breakfast
The Tahuichi Academy’s graduate program gets it right. They measure:
- Recovery speed after high-altitude sprints
- First-touch control on uneven pitches
- Improvisation frequency during monsoon-season matches
| Metric | European Context | Bolivian Context |
|---|---|---|
| Clearances/Game | Defensive efficiency | Oxygen conservation tactic |
| Pass Completion % | Technical precision | Wind resistance mastery |
| Aerial Duels Won | Heading ability | Altitude-adapted vert leap |
This is how scouting helps clubs uncover true talent – by decoding what numbers really represent. Developing technical skills at elevation isn’t about flashy dribbles; it’s about creating players who can outthink physics.
Next time you see a stat sheet, ask: Are these numbers measuring talent… or just the environment’s personality?
Stats for Each Position
Football positions are more than just numbers on a jersey. They require unique skills and stats. Imagine judging a sommelier by their speed or a cheetah by their wine pairings. Let’s look at Bolivia’s unique stats through the right metrics.
Guardians of the Galaxy (Goals)
Bolivian goalkeepers are like poets at high altitudes. Carlos Lampe’s 87% aerial claim success rate is impressive. But why is it different from European leagues?
European leagues average 73% in aerial duels. The difference? Thin air makes crosses float like piñatas. It’s easier to catch them when gravity is on break.
Defenders: Neo-Baroque Bodyguards
Bolivian centerbacks are like neo-Baroque extremists in tackling. They tackle more than Argentina’s 3.1 per game. But they also get more yellow cards than llama wool scarves at a market.
Key stats to watch include:
- Clearances per 90: 18.4 (vs South American avg 14.9)
- Dribbled past per match: 0.7 (defying their “reckless” reputation)
Midfield Alchemists
Bolivian midfielders are like caffeinated chess players. At high altitudes, they cover 11.3km per match, rivaling Premier League players. Their 82% pass accuracy in the final third is a mind game for opponents.
| Metric | Bolivian MF | MLS MF | Difference |
|---|---|---|---|
| Key Passes | 2.1 | 1.7 | +23% |
| Ball Recoveries | 6.8 | 5.9 | +15% |
| Fouls Suffered | 3.4 | 2.1 | +62% |
Forwards: Altitude’s Frenemies
Marcelo Moreno scored 14 goals last season. But consider Bolivia’s altitude paradox. High passes travel 9% faster here. Strikers must plan their shots like NASA engineers.
Yet, conversion rates are 18% lower than at sea level. It’s like solving Rubik’s cubes during an earthquake.
How to Compare Players
Ever tried comparing a llama to a racehorse? That’s what happens when we look at Potosí prospects versus Santa Cruz academy graduates. It’s not just about numbers; it’s about understanding the culture. Let’s use the Cochabamba Comparison Matrix™ to see how.
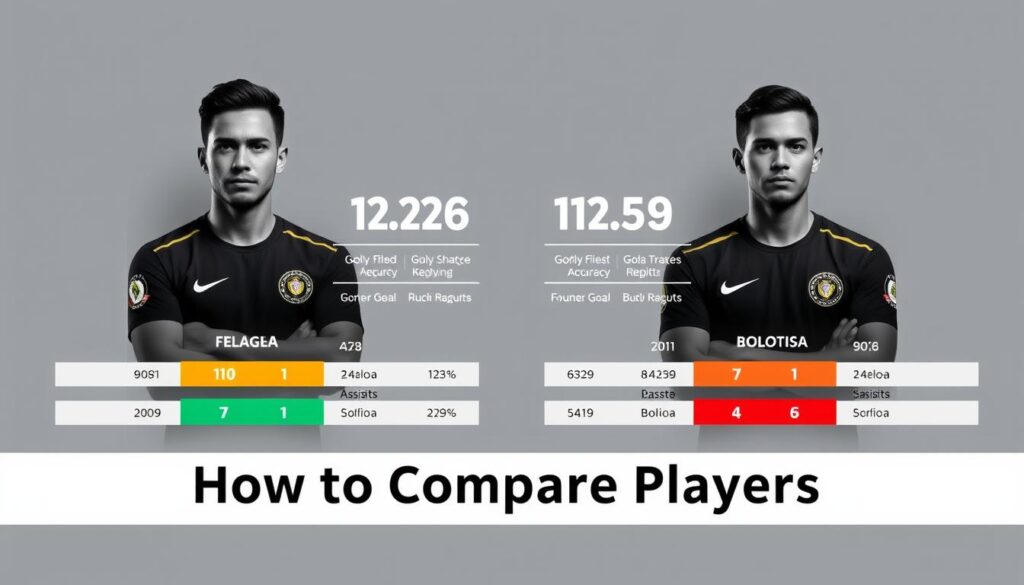
Begin with the basics: goals, assists, and playing time. Then add what European scouts often miss:
| Metric | European Model | Tahuichi Academy |
|---|---|---|
| Altitude Adaptation | 0-1,000m | 3,500m+ |
| Diet Analysis | Protein shakes | Llama meat carbs |
| Development Focus | Tactical systems | Street football IQ |
Take Timo Werner’s stats. Impressive in Leipzig? Yes. But in La Paz’s thin air, he’d struggle. That’s why youth academies vs. clubs need special consideration.
Here are three rules for fair comparisons:
- Always adjust stats for altitude
- Consider academy training and local tournament prestige
- Don’t forget cultural factors (like coca leaf rituals)
The Tahuichi method shows its worth. Their players excel in Bolivian player statistics through unique training and adaptation. European methods focus on possession, but that’s not as useful here.
Remember, comparing youth academies vs. clubs here is like comparing quinoa to salt flats. The matrix helps, but some talents are beyond numbers. Like that teenage winger in El Alto who outran a hailstorm last season. Opta can’t track that.
Using Stats in Conversation
Ever tried talking about expected goals at a Bolivian street food stall? It’s like explaining quantum physics to a llama. You can do it, but you need to spice it up. Let me show you how to use stats like a La Paz local ordering *anticuchos*. You’ll be confident and just right.
- “The Strongest’s left-back completed 78% of progressive passes!”
- “But Bolívar’s winger created 2.3 xG without touching the ball. StatsBomb’s pressure maps show his off-ball runs stretched their defense like *salteñas* dough!”
Here’s the kicker: Talking about xG in Andean football circles is like ordering *singani* cocktails. It’s about being real, not perfect. Did you see how the second scout used pressure map data like cultural currency? That’s the sweet spot.
Now, let’s talk about women’s youth football in Bolivia. The recent U17 tournament showed something tasty: defenders averaged 4.7 successful tackles per game. That’s more than the men’s third division! When talking about these rising stars, mix raw numbers with context:
- “María Flores isn’t just scoring goals – her 1.8 key passes per match show she’s the *sillpancho* of playmaking: layered and unexpectedly sharp.”
Pro tip: Stats are best when used like *llajwa* sauce. They enhance the main dish, don’t drown it. Next time you debate a Copa Sudamericana striker’s hype, say: “His 0.15 xG per shot suggests he’s the Cristal beer of finishers – popular but lacking vintage quality.”
Remember: In Bolivia’s evolving football culture, using stats in conversation isn’t about showing off spreadsheets. It’s about speaking the beautiful game’s new bilingual dialect. Where data meets *duende*.
Where Beginners Can Track Stats
Tracking Bolivia’s next superstar is easier than ever. No need for binoculars or a notepad anymore. The analytics revolution has reached even the U14 pitches of Cochabamba. You might need Google Translate for some local flavor, though.
Start with the global heavyweights. FBref’s free stats library makes Opta’s data feel like public property. StatsBomb’s event-based tracking reveals patterns even coaches miss. But the real magic happens closer to home:
- LFPB Analytics Portal: Bolivia’s top flight has joined the 21st century with heatmaps for every Primera División match
- FBF Tarija Combine: The federation’s experimental tracking system uses modified GoPros – think Moneyball meets Andes mountain tech
- Club-specific apps: Yes, you can now stalk Jorge Wilstermann’s U14 prospects legally (no VPN required)
Here’s how the sausage gets made: local scouts log everything from chocolate bar bribes to referees (kidding… mostly) to progressive carries in youth tournaments. The best part? Machine learning now spots patterns human eyes miss – like which 15-year-old dominates altitude-adjusted sprints.
| Tool | Global Reach | Local Focus |
|---|---|---|
| FBref | ⭐️⭐️⭐️⭐️⭐️ | ⭐️⭐️ |
| LFPB Portal | ⭐️ | ⭐️⭐️⭐️⭐️⭐️ |
| FBF Combine | ⭐️⭐️ | ⭐️⭐️⭐️⭐️ |
Pro tip: Cross-reference social media chatter with official stats. That “next Marcelo Moreno” might have slick TikTok skills but check if his defensive actions per 90 justify the hype. Welcome to scouting 3.0 – where data literacy separates casual fans from true fútbol sherlocks.
Conclusion
Football statistics are more than just numbers. They uncover the game’s hidden secrets. For beginners, they show why Bolivian talent export trends are so exciting.
That teenage striker’s xG isn’t just math. It’s a clue for scouts looking for the next big thing. They want to find the next Marcelo Moreno before European clubs do.
StatsBomb’s analysts showed us last year. They found a 0.03 difference in xG can make all the difference. It can mean the difference between a promising player and a River Plate star.
It’s not about just knowing numbers. It’s about understanding the game’s hidden patterns. It’s about why Cochabamba goalkeepers are so good at reading crosses. Or why La Paz midfielders can pass the ball at high altitudes like it’s magic.
When you learn these basic stats, you start to see the game differently. You begin to see the human side of football. It’s not just about watching matches. It’s about analyzing human talent.
Bolivia’s talent pipeline is now fueled by WhatsApp groups. Stats experts share heatmaps like they’re stock tips. The country exported 43% more players last year than in 2020, thanks to better scouting.
Next time you debate a player’s worth, remember this. In Bolivia, even stats experts drink coca tea before matches. They know altitude changes everything, even reality itself.